Expense Dashboard

Monitor Tally Expenses and Control Cost
Do you track your expenses on a daily basis? Tracking your spending on a regular basis can give you an accurate picture of where your money is going and where you’d like it to go instead.
What challenges for a Business Owner?
- What are our EXPENSES this month, last month, and year?
- Can we get an ALERT on suddenly going up or down?
- Which category has the most expenses?
- Any expenses suddenly going up or down
- What are the fixed expenses?
- What are the variable expenses?
- Should I reduce my expenses?
- Are expenses more or less than last month?
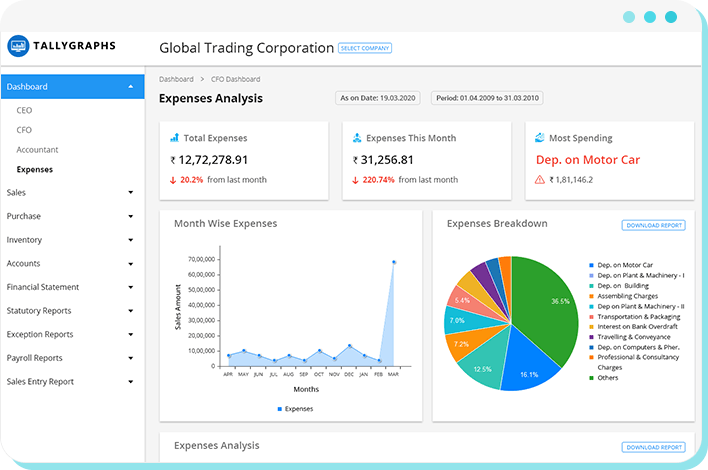
TallyGraphs Expense Dashboard
TallyGraphs Expense dashboard lets you to monitor your expenses from Tally data. This can give you an idea of where your expenses are allocated and if you have the opportunity to lower them as much as possible.
Expense dashboard is tailored to report the overall expenses. It collates and provides transactional data of all business-related expenses in an aggregated view.
Easy visualisation of expense data
Understanding and reading data is made simple with dashboard visualization. The expense dashboard surfaces necessary details with simple visuals so that an organization can easily make sense of their business expenses.
How can a Business Owner benefit?
- Identify top expenses and spending for this month, last month, and year
- Analysis expense trends of every month
- Breakdown your top expenses and compare
- Compare expense variations between a current month with last month
- Find any expenses suddenly going up or down