Finance Dashboard
Finance Dashboard
The Business owners choose the financial dashboard to keep track of all the data points they need for finances at any given point in time. Finance team responsibilities also include economic analysis to improve key business strategies. The financial dashboard helps to highlight the profitability of each active project, also it helps to understand the Income statement from revenue to net profit enhanced by relevant performance ratios.
What challenges do business owners face?
- How often companies monitor and report on financial performance?
- Who’s in charge of preparing financial reports for companies?
- How has financial monitoring and reporting changed for businesses in the past 12 months?
- How to calculate the net results for specific period?
- Finance process can slow down the whole organization?
- The month-end close process is more daunting than over?
- How to stay on top of the financial health of your business?
- What are our EXPENSES this month, last month, and year?
- Which category has the most expenses?
- What are the fixed expenses?
- Are expenses more or less than last month?
Key Highlights
- Improve decision making.
- To extract and manage data.
- Maintain transparency.
- Ensure everyone understands the data.
- Monitoring your cash flows including revenue and expenses throughout the organization.
- Avoiding risks and easy to view reports.
- Track revenue, expense and profitability
- Can be accessed anywhere, anytime, on any device
- Collects your raw financial data
- Identify top expenses and spending for this month, last month, and year
- Analysis expense trends of every month
- Breakdown your top expenses and compare
- Compare expense variations between a current month with last month
- Find any expenses suddenly going up or down
- Ease of customization
- Ease of integration
TallyGraphs Finance Dashboards
A financial dashboard is a business intelligence tool that allows finance and accounting teams to visualize, track, and report on financial statements.
Monthly Revenue, Profit and Loss & Expenses
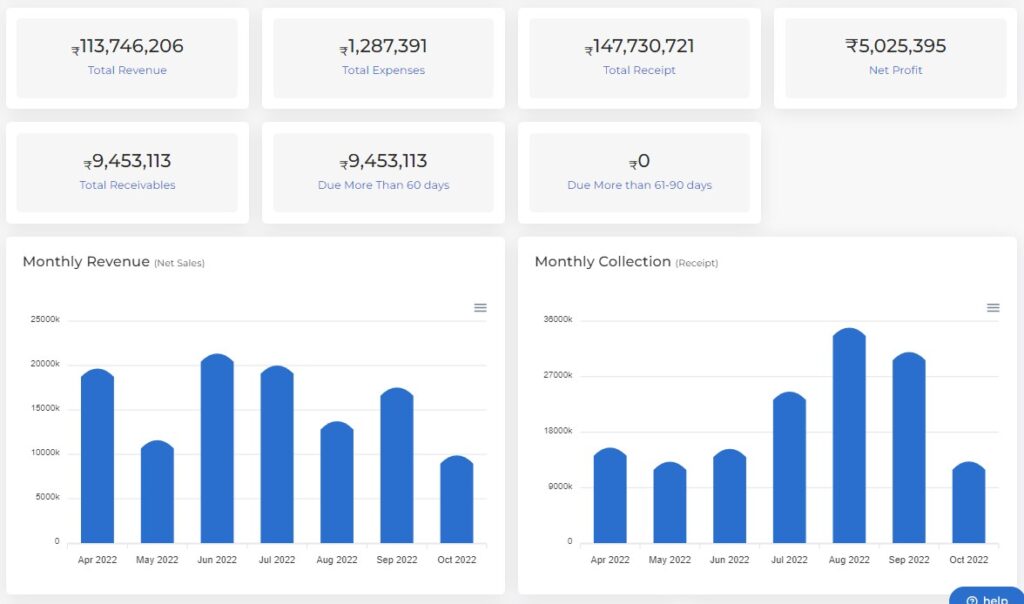
Monthly Net Sales indicates total amount of company’s gross sales according to customer and their sales in month wise.
Monthly Profit and loss demonstrates a financial statement that summarize the revenues, costs and expenses incurred over a calendar month.
Monthly Expenses utilized to analyze the top expenses and spending for month wise. Using expenses analysis, monitor your expenses by parent group wise.
