Customer Dashboard

Customer Dashboard – Party wise sales report
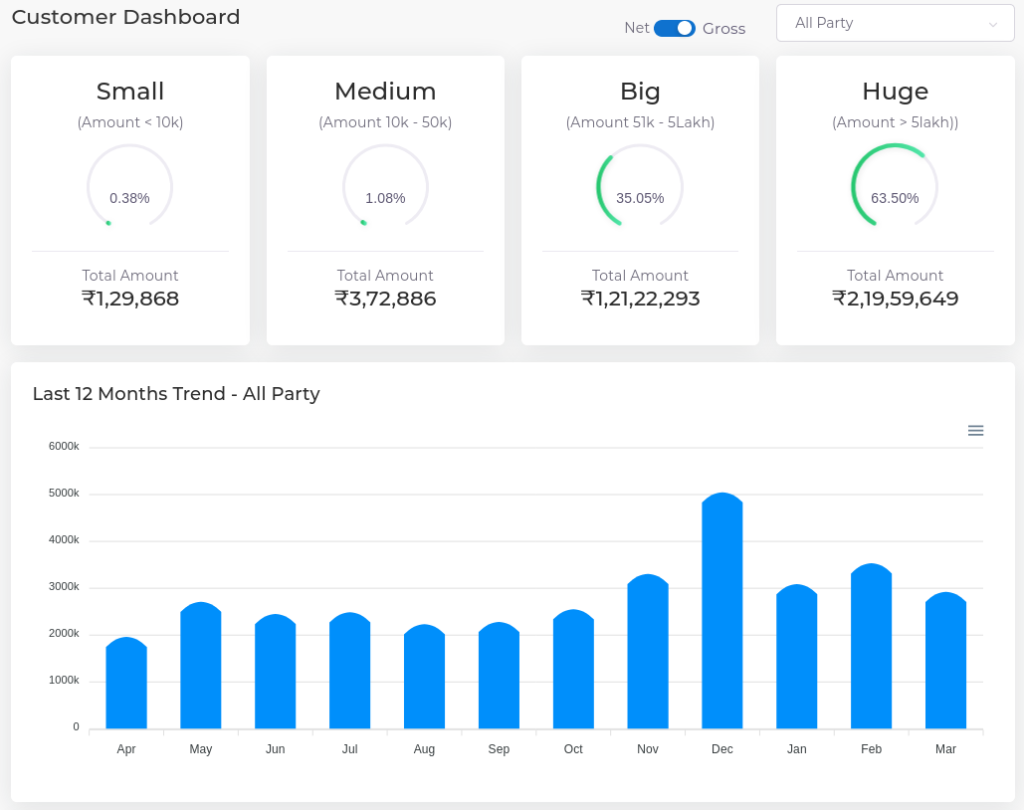
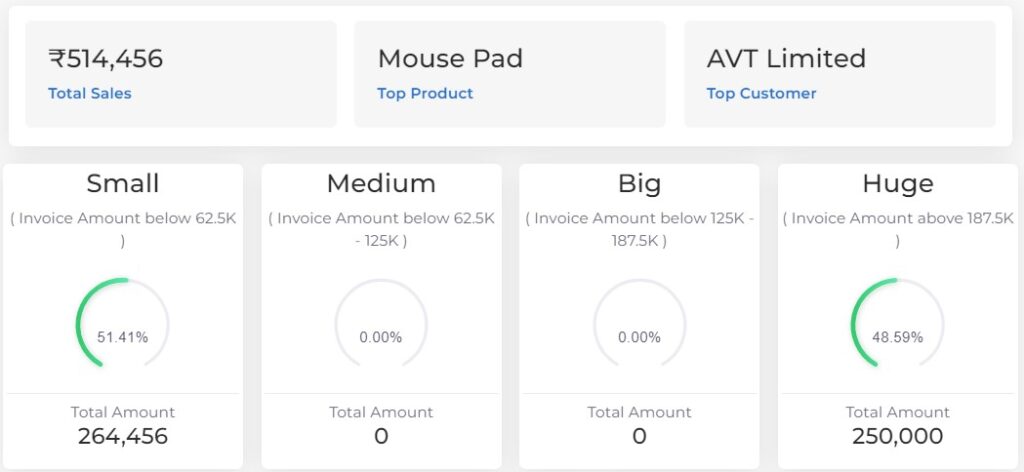
TallyGraphs customer dashboard lets you easily gather and visualize customers and track how your products are performing and demonstrate the value of your customers.
Why use a customer dashboard?
A customer dashboard will give you a real-time overview of your customer’s actions on your business. This data will let you find out who are your important customers, make informed decisions about your product efforts, measure the success of your business, and prevent poor customer satisfaction.
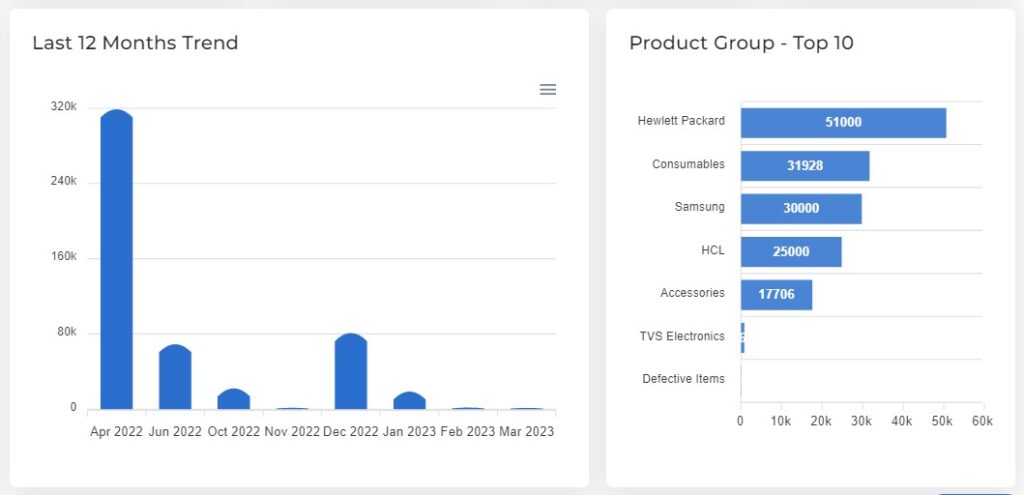
Sales Trend month to month
A detailed graph shows month-wise performance for all ledgers.
Group wise Product Performance
Shows group wise product lists based on the sales amount for the entire year.
Top Product Performance
Shows top product lists based on the sales amount for the entire year.
Product Analysis
The product analysis table explains the detailed data format of sales for product, and overall sales for the product can be determined month-by-month.
How will Customer Dashboard improve my business?
- Better identify your most valuable customer segments
- Improve your sales by only targeting those likely to be your best customers
- Increase customer loyalty by tailoring your products/services to your best customers
- Improve customer service
- Positively impact revenue and reduce waste across your organization

