Accounting Dashboard

Accounting Dashboard for Tally.ERP 9
Tracking your key accounting metrics from Tally ERP is more important to run your business. Waiting on multiple financial reports is a headache; TallyGraphs Accounting Dashboard aggregates all your accounting and finance metrics in one place. We get a quick analysis of Sales, Payments, Expenses, and much more.
The idea behind the TallyGraphs is to keep business owners, CEO, CFO, and accountants aware of what is happening in the business at all times.
Growth Metrics
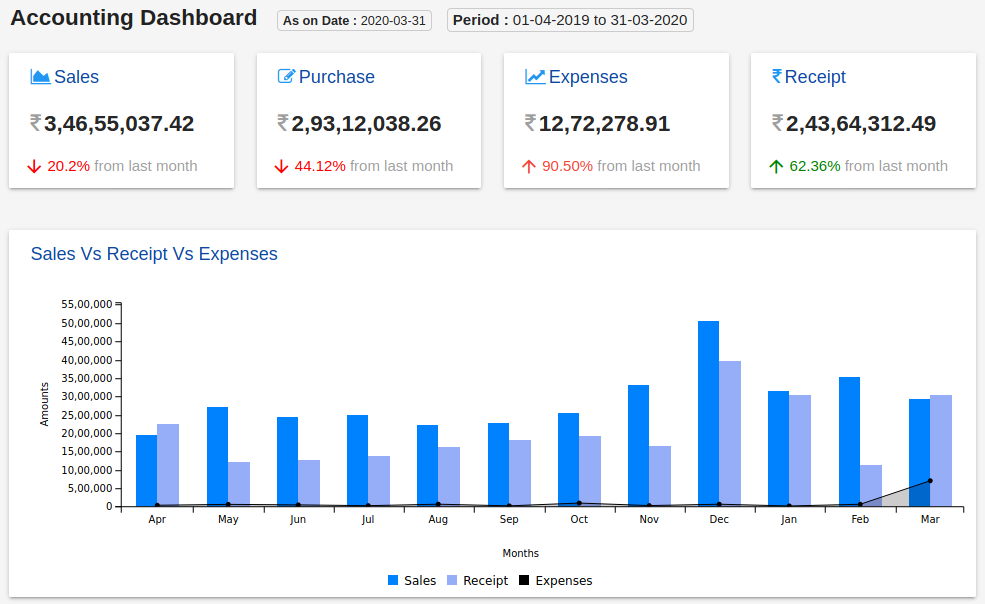
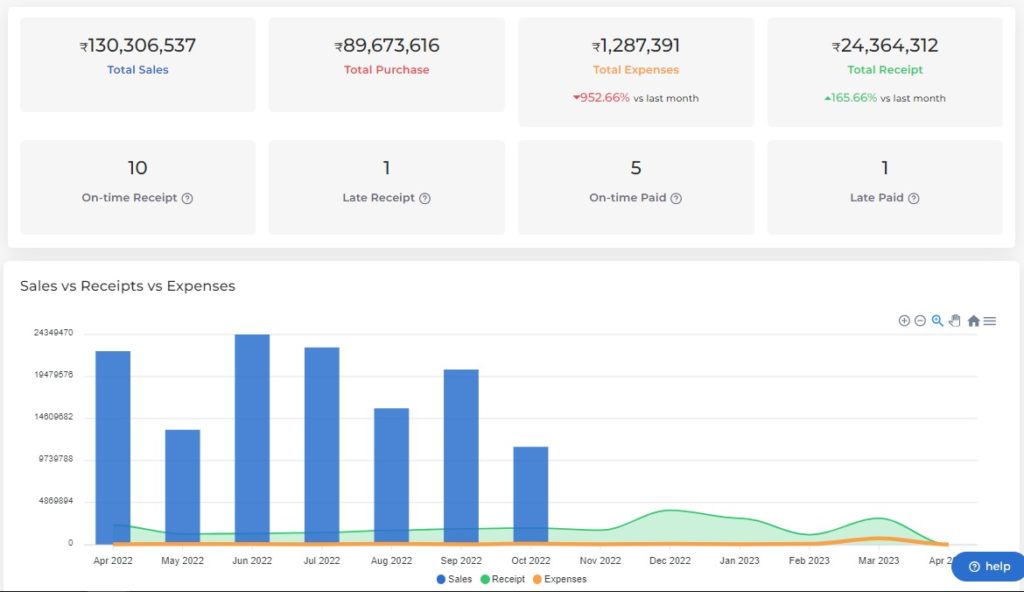
Top of the Accountant dashboard reflects your company’s growth against your sales, purchase, expenses, and collections, which means that you can always see what direction your revenue and retention should be going in.
Sales, Expenses, and Receipts in last 12 Months
Analyze the growth of your sales against Expenses and Receipts. Get an interactive view of your company’s monthly performance.
Receipts and Payments
Receipts aggregates the customer’s received amount from the sales for a particular period of time, also indicate whether the credit was made on time or late. Through the ledger group filter, you can customized your data by ledger group wise.
Payments aggregates the customer’s paid amount for the purpose of purchase for a particular period of time, also indicate whether the debit was made on time or late. Through the ledger group filter, you can customized your data by ledger group wise.

