Version 8.4.1 (Finance Dashboard)

The financial dashboard to keep track of all the data points they need for finances at any given point in time. The financial dashboard helps to highlight the profitability of each active project, also it helps to understand the Income statement from revenue to net profit enhanced by relevant performance ratios.
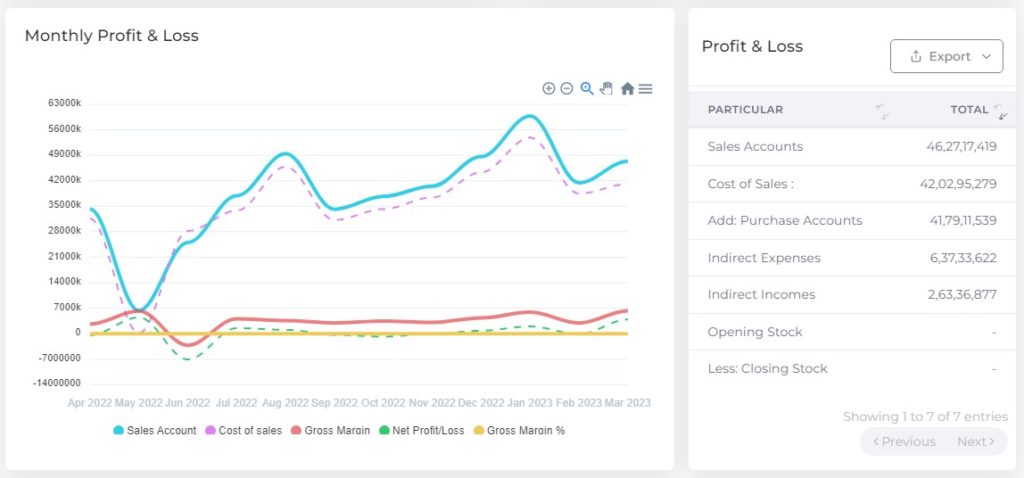
Monthly Profit and loss demonstrates a financial statement that summarize the revenues, costs and expenses incurred over a calendar month.
Monthly Expenses utilised to analyse the top expenses and spending for month wise. Using expenses analysis, monitor your expenses by parent group wise.
Pictorial representation of Top expenses by Group wise
Top expenses listed by group wise using expense breakdown in Expenses Dashboard.
You can track the Total (Group wise total expenses) and share of total (Group wise total expenses compared with overall expenses) through the expenses analysis.
Cash/Bank Summary
The Income and Expenditure account details described by group wise in cash and bank summary. Show zero balance filter used to hide the zero balance accounts from the view temporarily.