Customer Performance Dashboard
Customer performance dashboard, which provides sales performance of customer according to their sales amount, also track your customer performance daily via TallyGraphs.
Growth Metrics
Growth cards indicates important highlight inside the customer performance.
- Total Sales – indicates the overall total amount of sales.
- Top Product – indicates the highest product based on overall sales amount.
- Top Customer – indicates the highest customer based on the overall sales amount.

Sales segments
Sales segments indicates total sales amount and their average based on customer performance.
- Small –which represents total sales amount less than 10k.
- Medium – which represents total sales amount between 10k – 50k.
- Big – which represents total sales amount between 51k – 5Lakh.
- Huge – which represents total sales amount greater than 5Lakh.

Last 12 Months Trend & Top 10 Product Group
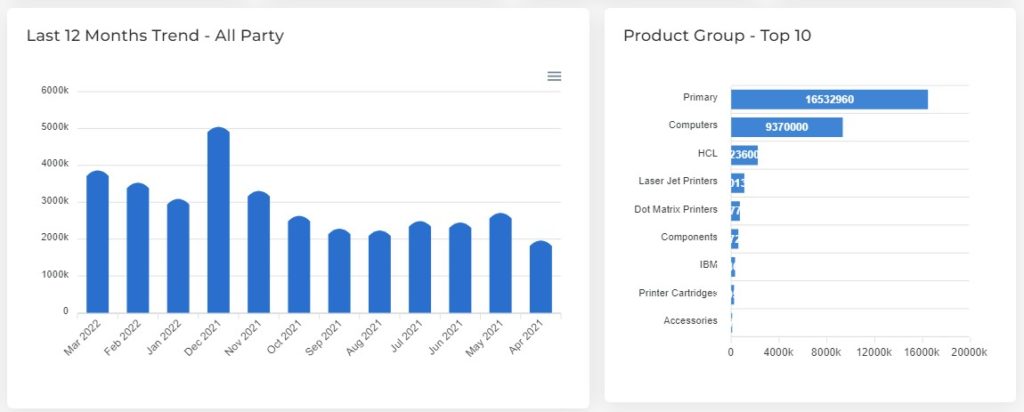
- Last 12 Months Trend shows the total amount of sales for customer in month wise.
- Top 10 Product Group lists the highest (top 10) products according to their total sales amount.

Product Performance
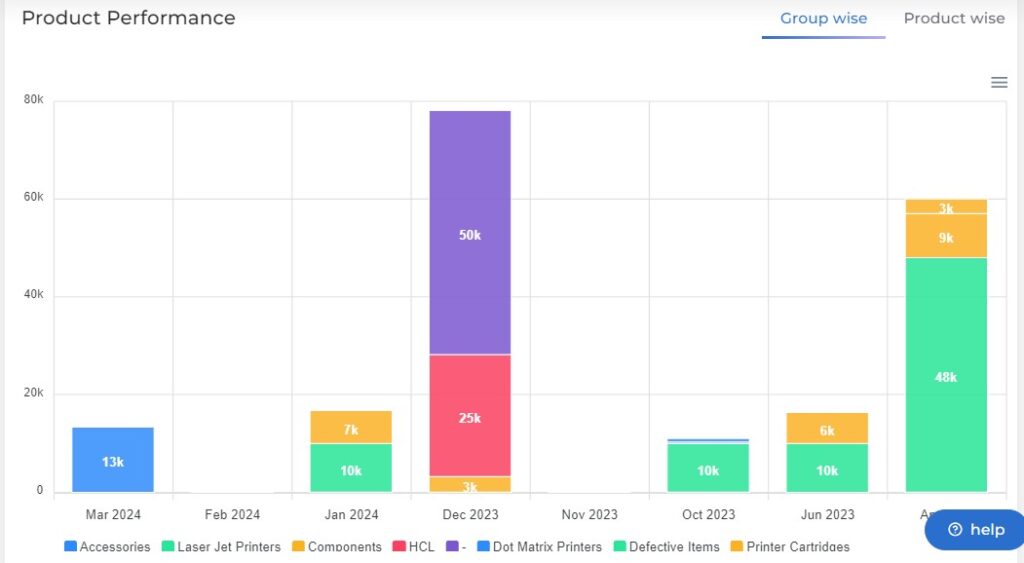
- Group wise performance shows the total amount of sales for category (group) in month wise.
- Product wise performance shows the total amount of sales for product in month wise.

Active & Inactive customers
Active customer – A customer who has purchased a business entity’s products at least once in a 12-month period.
Inactive customer – A customer who have engaged with a business entity’s products in the past but are not doing so now.
Product Analysis
The product analysis table explains the detailed data format for product by category, and overall sales for the product can be determined month-by-month.
Quantity & Amount Filter
If Amount is selected, product analysis table displays the amount details, based on the sold out products by product wise.
If Quantity is selected, product analysis table displays the quantity details, based on the sold out products by product wise.
- Show/Hide Months – using this option,you can select only the relevant month data and also hiding the rest.
- Export – used to download the product analysis table data in excel and pdf format.
Filter options
Following filter (Multi Select) options are available in Customer Performance dashboard. Using these multi select filters you can filter the data as per your needs.
More Filters
- Click the filters option to get more filters with multi select.
- Using these filter, you can filter the data by Ledger Group, Ledger, Sales Voucher, Cost Centre, Cost Category and Product.
- Additionally, you have the option for clearing all of the selected choices or just a specific one.
Net & Gross Filter
- Gross represents the total amount of sales and net represents the total amount of sales after deductions of taxes.
Range Filter
Range Filter, which helps to track the data on a day, week, month, and yearly basis. The options available in this filters are following:
- All year
- Financial year
- Calendar year
- This month
- This week
- Last week
- Last month
- Custom Date