Inventory Dashboard
TallyGraphs Inventory Dashboard delivers the information of Stock summary, assess value of stock items, inward and outward details, stock position, and stock by group.
Growth Metrics
Growth cards indicates important highlights inside the Inventory Dashboard.

Total Opening Value which represent the total value of products or materials that a company has available at the beginning of an accounting period.
Total Inward which represent the total stock has arrived for sales.
Total Outward which represent the total stock has despatched for sales.
Total Closing Value which represent the total value of products or materials that a company has available at the end of an accounting period.
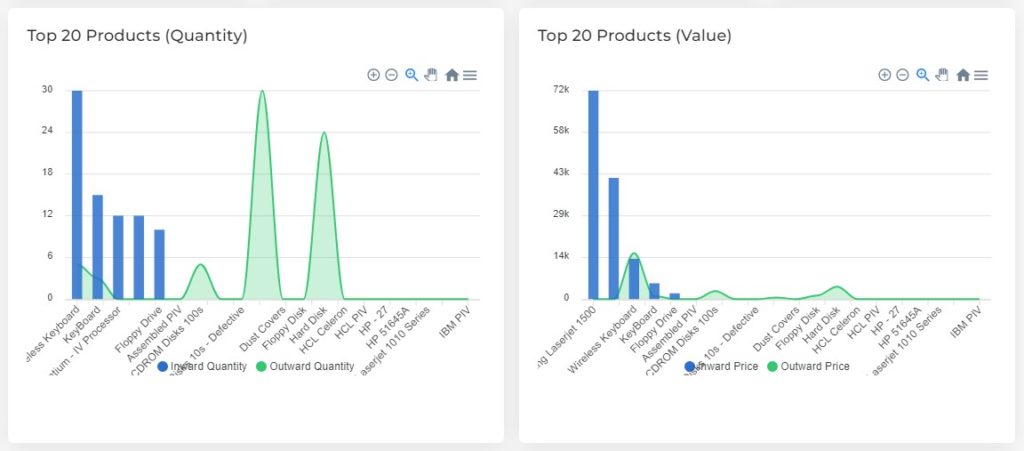
Simple analysis of Top products’ quantity and value
Top 20 Products (Quantity), which list out top products based on their volume of sales.
Top 20 Products (Value), which list out top products based on their sales amount.

Stock Summary
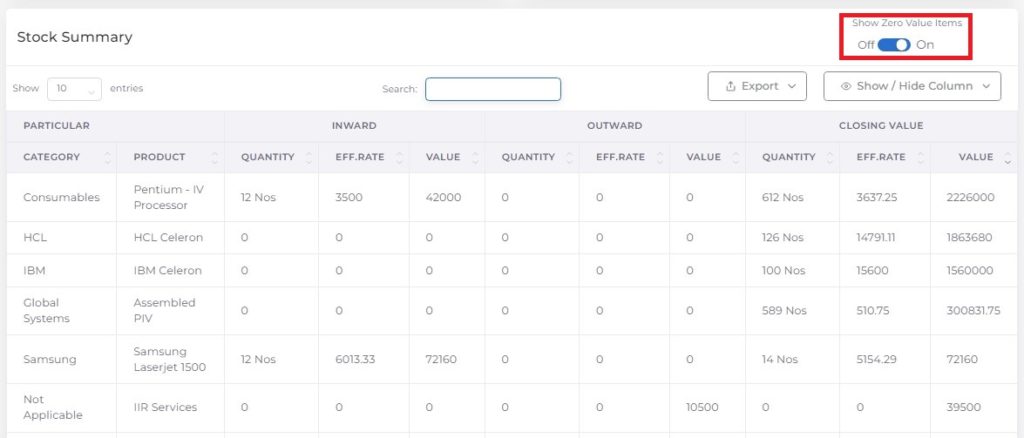
Stock summary demonstrate stock items by product group wise, also provide quantity, rate and value of stock items for both inward and outward movement as well as stock closure.

Zero Value Filter which is used to hide the zero value products temporarily from the view.
Show/Hide Columns using this option, you can select only the relevant column data and also hiding the rest.
Export used to download the stock summary data in excel and pdf format.
Filter Option
Product Group Filter – Using this filter you can filter the data by product group wise.