Finance Dashboard
TallyGraphs Finance Dashboard is a business intelligence tool that allows finance and accounting teams to visualize, track, and report on financial metrics.
Growth Metrics
Growth cards indicates important highlights inside the Finance Dashboard.

Total Net Sales – The total amount of a company’s gross sales minus its returns, allowance, and discounts.
Total Receivables – The total amount expected to be received from the parties.
Due More than 60 days –Payments are expected to receive from 60 days onward, indefinitely.
Due More than 61-90 days –Payments are expected to receive from 61 to 90 days.
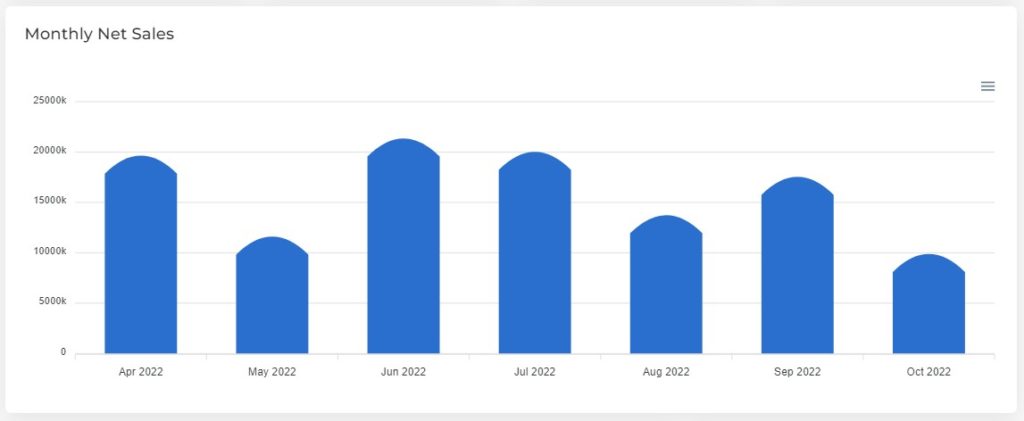
Monthly Net Sales
Monthly Net Sales indicates total amount of company’s gross sales according to customer and their sales in month wise.

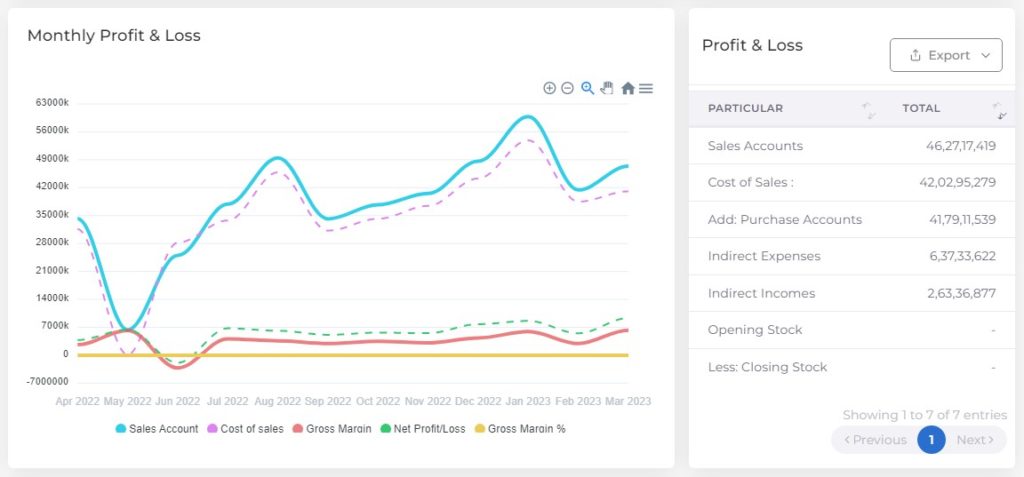
Monthly Profit & Loss
Monthly Profit and loss demonstrates a financial statement that summarize the revenues, costs and expenses incurred over a calendar month.

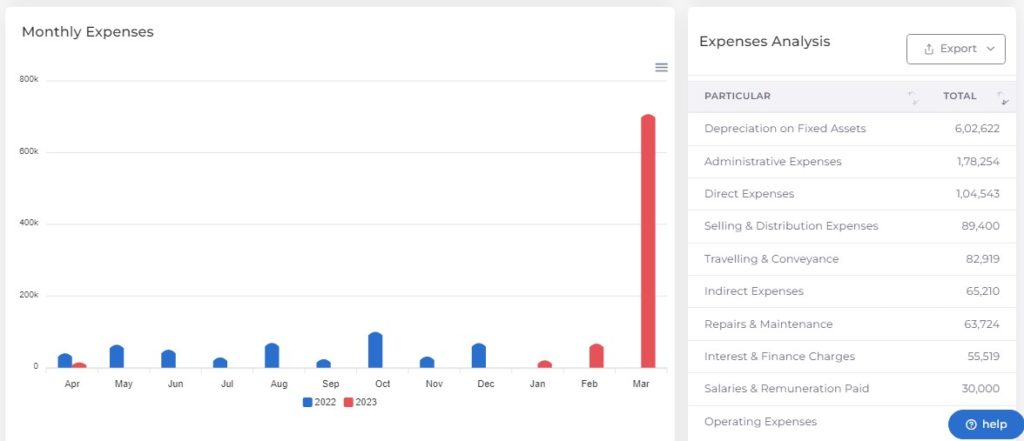
Monthly Expenses
Monthly Expenses utilised to analyse the top expenses and spending for month wise. Using expenses analysis, monitor your expenses by parent group wise.

Filter Options
Month Filter – Using this filter you can track your financial reports according to your needs month by month.