Expense Dashboard
Through the TallyGraphs Expense Dashboard, you can monitor your expenses from tally data, also you can obtain an accurate assessment of where your expenses spent majority and take steps to reduce those costs.
Growth Metrics
Growth cards indicates important highlights inside the Expense Dashboard.

Total Expenses which represent the total amount spent by customer for their business.
Expenses This Month which represent the total amount spent by customer for current month.
Most Spending it shows which product have customer spent more amount on.
Easy visualization of expense data
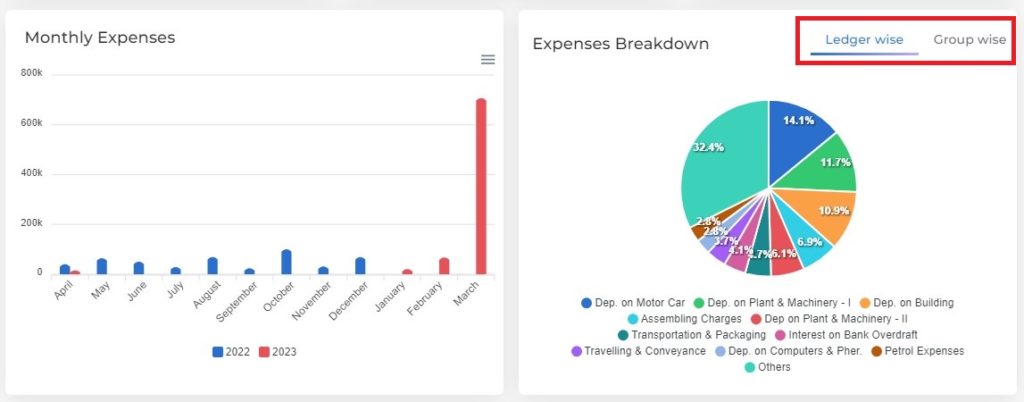
Monthly Expenses utilised to analyse the top expenses and spending for month wise.
Expense Breakdown, provides an accurate evaluation of your expenses by Ledger wise and Group wise, also it’s used to breaks down your top expenses.

Expenses Analysis
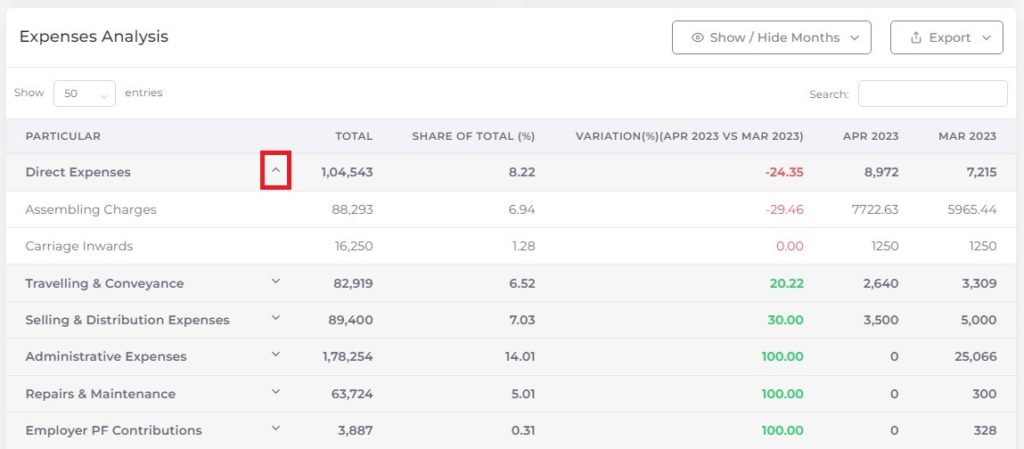
Using Expenses Analysis, monitor your expenses by Parent group wise, also click the option to view the customer details under the parent group.

Show/Hide Months Using this option, you can select only the relevant month data and also hiding the rest.
Export Used to download the expenses analysis data in excel and pdf format.
Filter Options
Following filter options are available in expense dashboard. Using these filter you can filter the data as per your needs.
Month Filter Using this filter you can track your expense details according to your needs month by month.
Date range filter The following options are available in range filters.
- All Years
- Current Financial Year
- Current Calendar Year
- Current Quarter
- This Month
- Previous Financial Year
- Previous Calendar Year
- Previous Quarter
- Previous Month