Customer and Product Dashboard
Customer and Product Dashboard allows you to track how your business performing and demonstrate the revenue of your business based on the products and their groups.
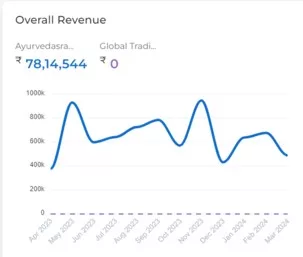
Find out how your revenue is growing?
Overall revenue represents each company’s revenue data based on month wise performance of their business.

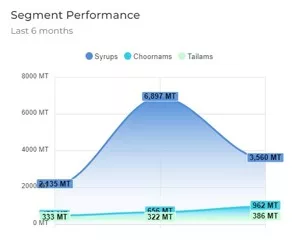
Know your top product group performance
Using the segment performance, you can track your top three product group statistics based on last six month analysis.

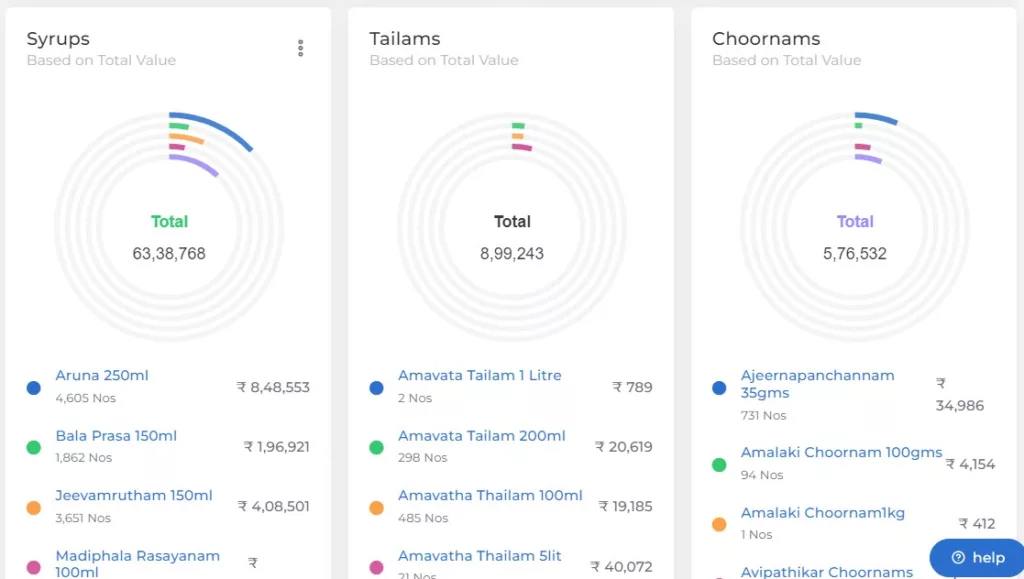
Track your sales data based on top three product groups or as needed
Each segment’s graphical depiction shows the first five products’ with sales amounts from the total sold out product details provided below.
You can choose which product group details to track via the dashboard settings.

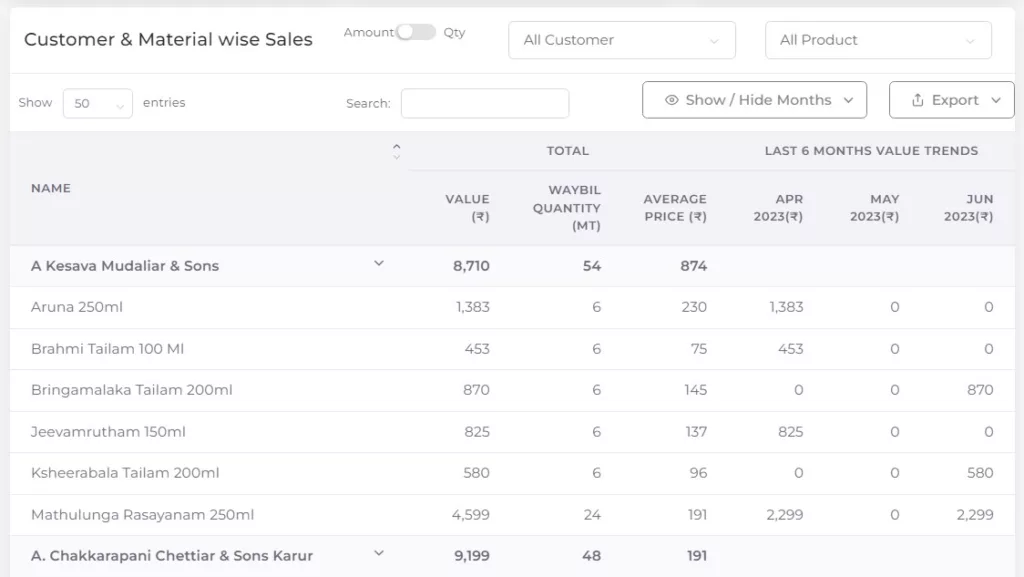
Customer and Material wise Sales
It represents the customer wise sold out products based on last six month analysis and also you can track by customer and product using filters.

Filter Options
Company Filter
This selected all of the companies that were available; if not necessary, you may deselect that.
Range Filter
Range Filter, which helps to track the data on a day, week, month, and yearly basis. The options available in this filters are following:
- Financial Year
- Calendar Year
- Current Quarter
- Previous Quarter
- This Month
- This Week
- Last Week
- Last Month
- Custom Date
Dashboard Settings
Segment Preference – The top three product groups from segment performance, which are automatically chosen in segment preference of dashboard setting, can be changed based on your needs if you want to track any other product group.
Excludes – which is used to neglect the selected voucher type and product.
*Note: You must choose name and product group for each segments in segment preference.