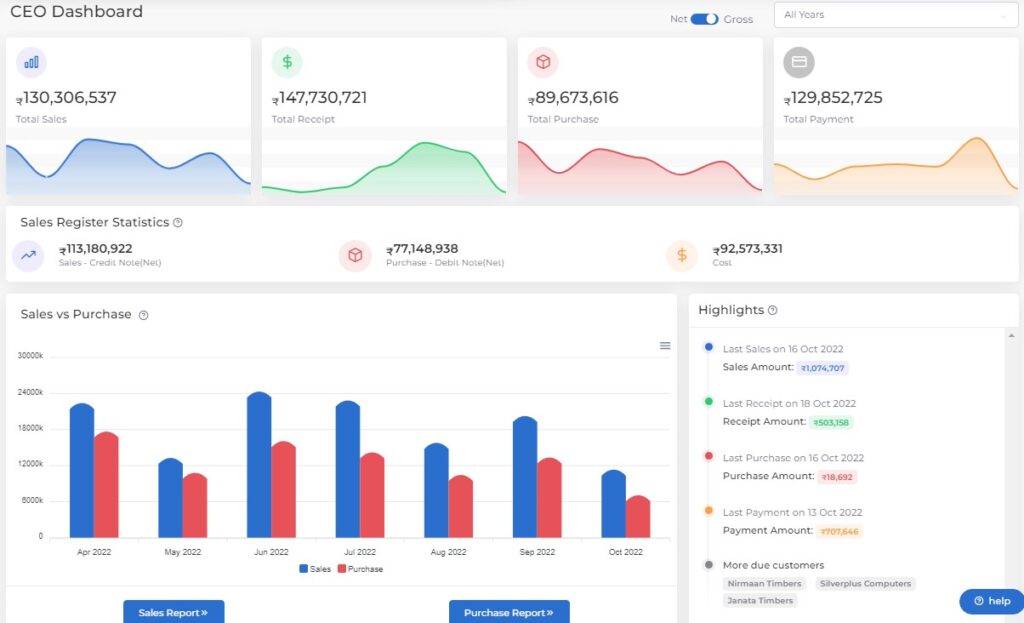
CEO Dashboard

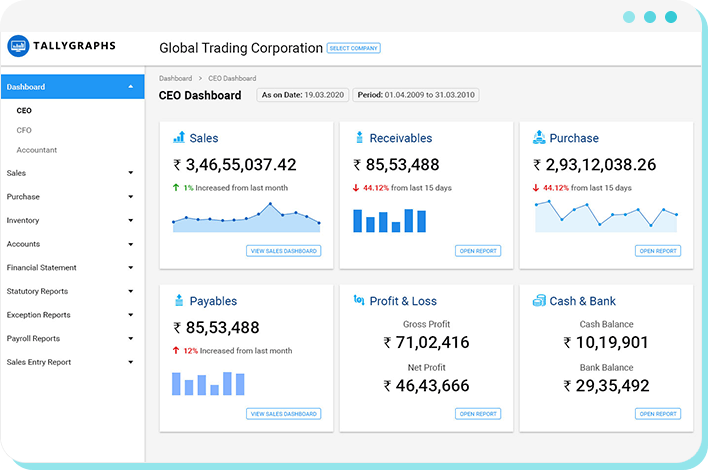
Month wise Sales
- Sales comparison graph in month wise
- The graph values based on Tally sales transactions amount
- Total sales amount is closing balance of sales group transactions amount
- Verify the sales amount in Tally Sales Register menu
Month wise Purchase
- Purchase comparison graph in month wise
- The graph based on Tally purchase transactions amount
- Total purchase amount is closing balance of purchase group transactions amount
- Verify the purchase amount in Tally Purchase Register menu
Outstanding Receivables
- View your customer’s or debtor’s outstanding (receivable) amount graph in current Financial period
- Receivable amount value is based on given credit day’s wise
- Total outstanding amount is sum of Sundry Debtors or customers pending bills
- If you have using multiple financial year data means last year outstanding closing balance is affected this year also
- Verify your outstanding amount in Tally Outstanding (Receivables) menu
Outstanding Payable
- View your supplier’s or creditor outstanding payable amount graph in current period
- We are split the payable amount is based on credit day’s wise
- Total outstanding amount is sum of Sundry Creditors or Supplier pending bills
- If you have using multiple financial year data means last year outstanding closing balance is affected this year also
- Verify your outstanding amount in Tally Outstanding (Payable) menu
Cash and Bank balance
- You can check your Cash and Bank balance
- Verify your cash and bank balance in Ratio Analysis menu in Tally
Profit and Loss
- You can check your current profit and loss amount in TallyGraphs application
- Verify your profit and loss amount in Profit & Loss A/C menu in Tally
