Releases

Version 8.4.5 ( Enable Accounts Ledger )

1. Sales Dashboard

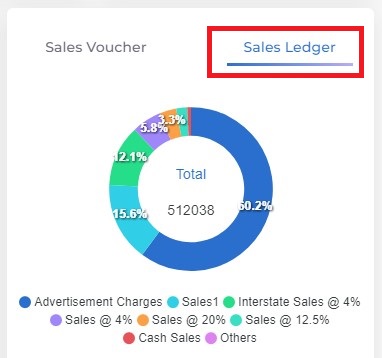
Two more filters Sales Ledger and Sales Voucher added with existing filter option. Other micro updates are

  • Previous and Current Quarter added in date range filter.
  • Set as default – Save current selected filters and load as default value.
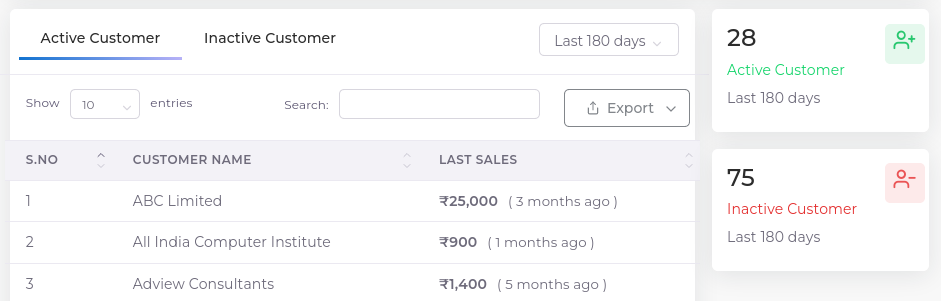
  • Hyper link for Top customer table to explore detailed view of the transactions.
image

Added KPI Highlights for Invoice performance

2. Purchase Dashboard

Additional two more filters Purchase Ledger and Purchase Voucher added with existing filter option. Other micro updates are

  • Previous and Current Quarter added in date range filter. Set as default – Save current selected filters and load as default value.

3. Custom Apps

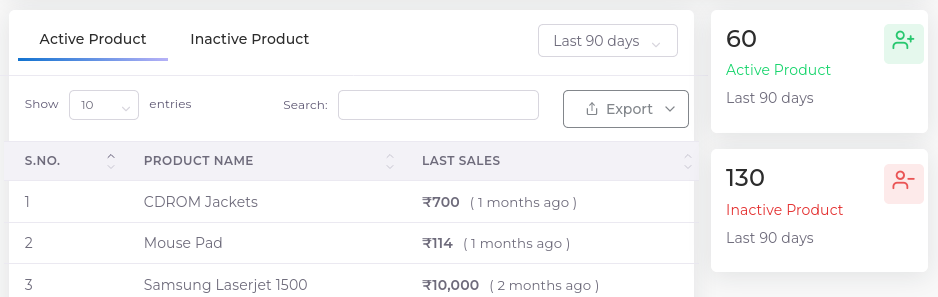
Following changes updated in Region wise sales, Sales person performance, Customer performance, product performance and cost center

  • Added Voucher type (sales voucher) filter
  • Product Rate => Product performance, debtor

Version 8.4.4 (Reports on WhatsApp)

1. Get Business Reports on WhatsApp Daily

Reporting is important to keep track of your data, measure your performance, and analyze what can be improved. As a user of our TallyGraphs + WhatsApp, you can receive your business reports on WhatsApp daily automated.

How to setup WhatsApp notification

2. Track Active/Inactive Customers

Track Active/Inactive Customers, we can analyze that when each of the customers last sales date. Also, conclusions can be drawn and henceforth, strategies can be planned based on this data with regards how to approach the customers so that these inactive customers can be billed again.

3. Track Active/Inactive Products

Looks like customers, we can analyze Active and Inactive Products based on lased sales date.

Version 8.4.3 (One Time Passcode)

Let Users Login with One Time Passcode

Now all the users can log in simply with OTP passcode SMS sent on their mobile phone number. No more checking emails and remembering passwords.

Product Quantity

Item Quantity is added in Product Performance & Customer Performance Apps.

Additional filters with multiple selections

More filters were added in Sales Dashboard, Regional Sales, Cost Center, Customer Performance, and Product Performance Apps to access the dashboards with more interactive.

Version 8.4.2 (Top Sales Ledgers)

Added a new graph for Sales Ledger in Sales Dashboard which indicates the top 10 sales ledgers based on the sales registere account.

Filter Receipts by Ledger Group in Accounting Dashboard

Through the ledger group filter, you can customize your receipt entries by ledger group for both receipts and payments.

Month wise Summary in Statement of accounts

Display Sales, Purchase, Receipt a,nd Payment Performance month wise which describes a detailed breakdown and comparison by month wise.

  • Click the Filter option to get more filters.
  • Cost category filter is used to keep track of data by cost category, which is used in the determination of cost limitations and rates.

Debit and Credit values distinct by Opening and Closing Balance

Debit and Credit amounts are determined based on their opening and closing balance in Trial Balance.

Group wise Total in Cash and Bank Summary

The total credit, and debit amount are determined by group-wise in cash and bank summary.

Other Updates

Update: Total quantity of stocks and inventories (table footer) added in Export options for all stock and inventory dashboards.

Fix: Growth trend graph invisibility, while applying the filter in Cost centre dashboard.

Version 8.4.1 (Finance Dashboard)

The financial dashboard to keep track of all the data points they need for finances at any given point in time. The financial dashboard helps to highlight the profitability of each active project, also it helps to understand the Income statement from revenue to net profit enhanced by relevant performance ratios.

Monthly Profit and loss demonstrates a financial statement that summarize the revenues, costs and expenses incurred over a calendar month.

Monthly Expenses utilised to analyse the top expenses and spending for month wise. Using expenses analysis, monitor your expenses by parent group wise.

Pictorial representation of Top expenses by Group wise

Top expenses listed by group wise using expense breakdown in Expenses Dashboard.

You can track the Total (Group wise total expenses) and share of total (Group wise total expenses compared with overall expenses) through the expenses analysis.

Cash/Bank Summary

The Income and Expenditure account details described by group wise in cash and bank summary. Show zero balance filter used to hide the zero balance accounts from the view temporarily.

Version 8.4.0 (Inventory Dashboard)

Display the quantity details of Inventory dashboards

Quantity details provided by stock summary on inventory dashboard, inventory report, stock summary, stock summary with profit, and stock category summary, which shows how many products are held (each product separately) in godown for both opening and closing as well as inward and outward.

Inventory Dashboard

Inventory Report

Stock Summary

Stock Summary with profit

Stock Category Summary

TallyGraphs shows all local languages supported by Tally

TallyGraphs allows any languages to entering the customer details through the Tally configuration.

Reset Password
Register